North Carolina’s Vision Zero Map: Making Sense of Traffic Crash Patterns
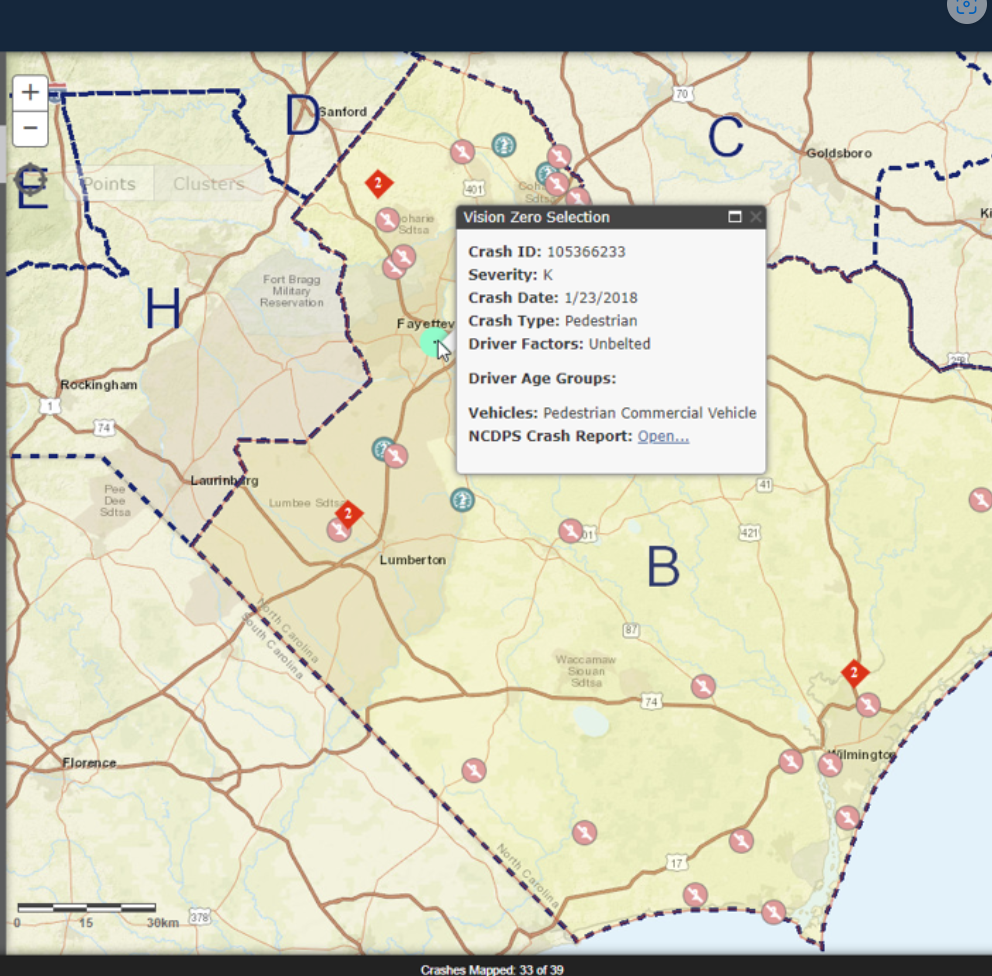
The Institute for Transportation Research and Education at North Carolina State University wanted to project the number of deaths per year resulting from risky driving behavior onto a centralized map that could be sorted by different demographics and updated by multiple sources. The solution? The North Carolina Vision Zero Map. This map was a collaborative initiative to help eliminate roadway deaths and injuries in the state. The aim was to create a single map of deaths by year in order to recognize and understand patterns and allow for easier interpretation of multiple data sets from different sources.
This map enables policymakers and the public to see what types of accidents specific geographic areas experience compared to other areas, and it allows them to view information sorted by different time periods, age of drivers, or type of incident. Seeing this data visually on a map gives a clear picture of the patterns that emerge over time in specific areas.
The Vision Zero Map was launched at the end of November 2017 using ArcGIS® API for JavaScript. Argis Solutions created a data warehouse system for the multiple data sources that would be displayed together on the same map. Argis also helped with UI (user interface) development, producing a responsive design for both web and mobile users.
This system allows multiple sources of data to converge, building a more complete picture of traffic crashes because the data is aggregated together in a sensible manner. Patterns are more easily seen and detected, and the objective is to find solutions and bring awareness to what caused the accidents in the past. Eventually, the hope is to reduce traffic deaths to zero. This map is paving the way to a better driving future for the state of North Carolina.